

September 10, 2026
Trucking News - US Freight Rates
September 21, 2026 - Courtesy of DAT Trendlines
| SEP 21 – SEP 27 VS SEP 14 – SEP 20 | AUG 2026 VS JUL 2026 | AUG 2026 VS AUG 2025 | |
| Van Load-To-Truck | +2.0% | -1.2% | -35.3% |
| Van Rates (Spot) | +1.6% | -3.7% | +46.8% |
| Flatbed Load-To-Truck | +3.1% | -15.3% | +80.4% |
| Flatbed Rates (Spot) | 3.9% | -2.7% | +42.7% |
| Reefer Load-To-Truck | -2.6% | -4.2% | +93.2% |
| Reefer Rates (Spot) | -6.8% | -0.6% | +40.7% |
| Fuel Prices | +3.8% | +10.1% | +46.0% |
Van Freight Rates - September 21, 2026
DAT.com’s September 21st Trendlines Report shows current national van spot rate averages are $3.00 per mile, 11¢ higher than the August average. The highest average van rates are in the Midwest at $4.06 per mile. The lowest average van rates are in the Southeast at $3.05 per mile.
The current national van load-to-truck ratio is 11.2 loads-to-truck, compared to the August average of 10.3. Ratios are relatively consistent across the country, with higher concentrations in the Northeast, Washington, and Oregon.
.png?width=1024&height=633&name=Sept.%20trucking%20SIT%20Video%20(4).png)
Reefer Freight Rates – September 21, 2026
Reefer freight rates are averaging $3.62 per mile, 23¢ higher than the August average. Rates are highest in the Midwest, with an average of $4.06 per mile. The lowest rates are in the Southeast, with an average of $3.05 per mile.
The current national reefer load-to-truck ratio is 18.1 loads-to-truck, compared to the August average of 20.02. Ratios vary across the country, with stronger load-to-truck ratios in the northern states and lower ratios throughout the South.
.png?width=880&height=549&name=Sept.%20trucking%20SIT%20Video%20(5).png)
Flatbed Freight Rates – September 21, 2026
National average flatbed rates are $3.60 per mile, 6¢ higher than the August average. The Southeast has the highest average flatbed rates at $3.78 per mile. The lowest rates are in the West, with an average of $3.12 per mile.
Nationally, flatbed load-to-truck ratios are at 40.47, compared to 36 in August.
For more details, visit DAT.com.
.png?width=880&height=544&name=Sept.%20trucking%20SIT%20Video%20(6).png)
Diesel Prices – September 21, 2026
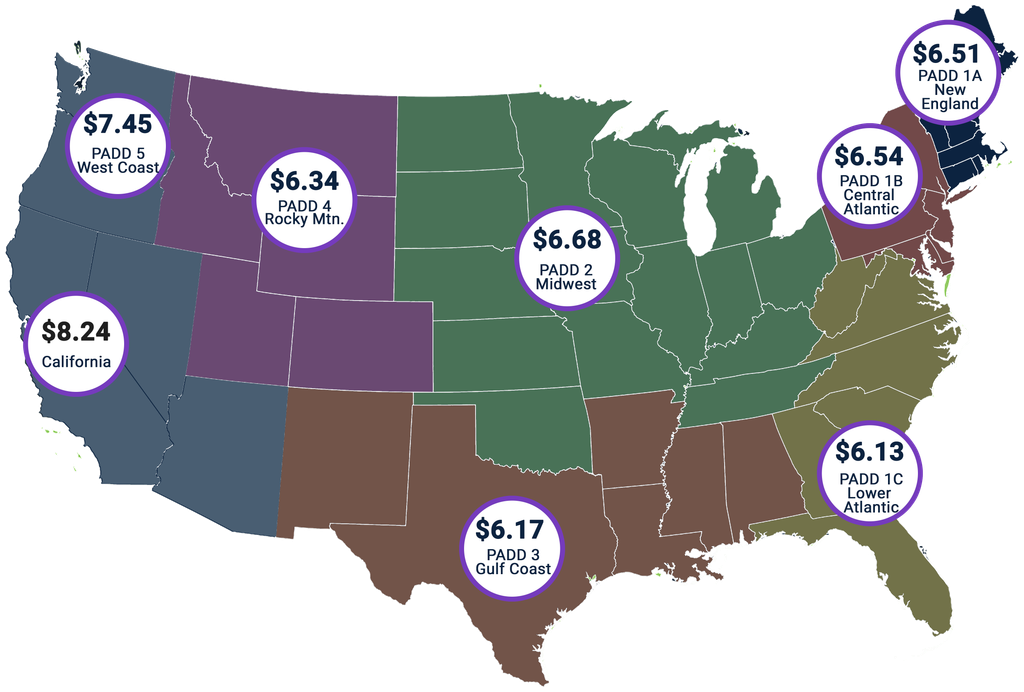
Fuel prices remain a key concern, with diesel costs continuing to drive the conversation across the industry. Fuel prices are up 90 cents from last month and $2.78 from a year ago. Carriers should continue monitoring fuel surcharges and route efficiency as rising fuel expenses can quickly impact profitability.
East Coast diesel prices are averaging $6.26 per gallon. The average price in the Midwest is $6.68 per gallon. California diesel prices are averaging $8.25 per gallon.
| Change from | |||||
| 9/7/2026 | 9/14/2026 | 9/21/2026 | Year Ago | Week Ago | |
| US | $5.967 | $6.285 | $6.529 | +2.78 | +0.244 |
| East Coast (PADD 1) | $5.744 | $6.158 | $6.268 | +2.523 | +0.110 |
| New England (PADD 1A) | $5.99 | $6.202 | $6.517 | +2.555 | +0.315 |
| Central Atlantic (PADD 1B) | $6.051 | $6.312 | $6.546 | +2.638 | +0.234 |
| Lower Atlantic (PADD 1C) | $5.605 | $6.096 | $6.139 | +2.475 | +0.043 |
| Midwest (PADD 2) | $5.946 | $6.250 | $6.68 | +2.949 | +0.430 |
| Gulf Coast (PADD 3) | $5.754 | $6.027 | $6.177 | +2.777 | +0.150 |
| Rocky Mountain (PADD 4) | $5.805 | $6.066 | $6.34 | +2.593 | +0.274 |
| West Coast (PADD 5) | $6.987 | $7.25 | $7.456 | +2.932 | +0.206 |
| West Coast less California | $6.314 | $6.566 | $6.791 | +2.668 | +0.225 |
| California | $7.764 | $8.039 | $8.246 | +3.261 | +0.207 |
Tag(s):